Chief Investment Strategist, The Freeport Society
His heart was failing. So he upgraded it.
After a weapons test gone wrong, Tony Stark was taken hostage in a dimly-lit cave in Afghanistan—his chest filled with shrapnel that was slowly moving toward his heart.
Faced with that situation, most people would give up.
But Stark engineered a fusion-powered device to keep the shrapnel from killing him.
It did more than that. It powered his escape. Eventually, it powered the suit that turned him into Iron Man.
If you’ve seen the Marvel movies (or even better, read the comics), you’ll know that Stark didn’t have superpowers. He wasn’t bitten by a spider… exposed to gamma rays… or born on another planet.
Instead, he was a super smart guy who built tools to augment his human abilities – jet powered flight, a near-invincible exoskeleton, and a super intelligent AI assistant that could monitor his vital signs, run predictive combat simulations in real time, and design new tech on the fly.
These tech upgrades didn’t replace Stark’s genius – they amplified it. The resulting human-machine hybrid became more powerful than any human could ever hope to be on their own.
That’s what smart investors are doing today.
Like Stark, they’re using technology to give themselves an edge. They’re using advanced algorithms, screens, and even AI to spot opportunities to profit.
We’ve been ahead of the curve with our Freeport Alpha advisory.
It’s a quant-based system from our colleagues at fintech platform TradeSmith. It highlights opportunities to invest based on the big institutional money flowing into the stock.
And the results have been impressive. Wins over the past year, include:
- 92% in Palantir (PLTR) in just three months
- 83% in Hims & Hers (HIMS) in four months
- 81% in GEO Group (GEO) in four months
- 41% in Doximity (DOCS) in two months
- 41% in Ares Management (ARES) in 10 months
And tracking money flows isn’t the only way to stack the odds in your favor.
Today, I’ll introduce you to another TradeSmith tool. It finds seasonality patterns in stocks. And although you can’t see these patterns with the human eye, some of them can be incredibly strong.
Over 15 years of backtesting, some have occurred upward of 80% of the time. This includes years when everything else was falling.
TradeSmith CEO Keith Kaplan launched this tool back in January. It was one of the biggest successes in our industry so far this year. So big, in fact, that he’s hosting a new event all about a recent seasonality breakthrough tomorrow. (Sign up here.)
Today, I want to share a “rapid-fire” investment based on the seasonality patterns the TradeSmith tool has identified.
First a quick word on seasonality… and how the tool works.
Buy on These “Green Days”
To the naked eye, the stock price moves look erratic – rising one day, falling the next, with no rhyme or reason.
But once you sift through decades of price data using pattern-recognition software, a different picture emerges.
Some stocks don’t move randomly at all. They follow rhythms – tending to rise or fall during the same windows each year.
The folks at TradeSmith call them “green days.” By spotting upcoming green days, and trading them, you can stock the odds in your favor.
It’s not 100% accurate. No system is. But some stocks have hit their green days 80%, 90%, even 100% of the time over the past 15 years.
In other words, stocks have seasons. And those seasons repeat – year after year.
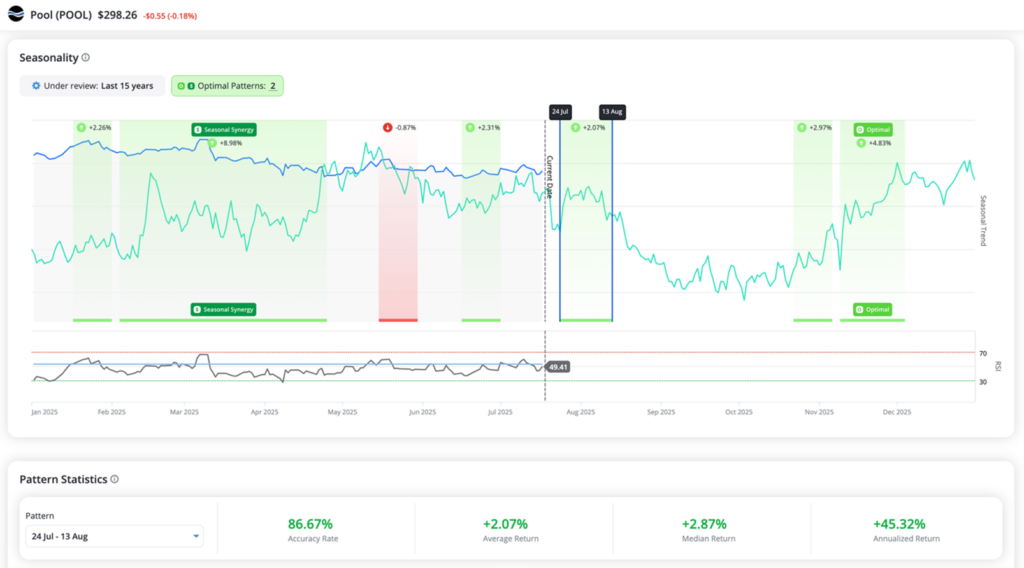
Take this seasonality trade I want to share with you, Pool (POOL).
It’s the world’s leading wholesale distributor of swimming pool equipment.
And it doesn’t take a data scientist to understand why a company that supplies swimming pools would tend to do well when it’s hot.
In the three-week window between July 24 and August 13, the stock has risen 86.6% of the time, with a median return of close to 3%. That works out to an annualized return of over 45%.
But we’ll have a shot at an even higher return later this year.
In the October 3 to December 4 window, the stock has averaged returns of 8.1%, which annualizes to 58%. It’s done so with 86% accuracy.
Seasonal analysis is not deterministic. It is not preordained that the stock has to perform exactly as it has in the past. This is probabilistic – we’re placing our bets based on what has happened in the past.
To find out how to tilt the odds in your favor, remember to sign up to Keith’s event tomorrow.
When you sign up, you’ll get free access to seasonality charts on the webinar website and can take a closer look at the seasonality patterns for your favorite stocks… and even indexes like the S&P 500 and the Nasdaq.
To life, liberty, and the (augmented) pursuit of wealth.