Chief Investment Strategist, The Freeport Society
We’re living in an Age of Chaos. You see it in the capital markets, the economy, and in our politics. It’s pervasive.
But can we find patterns in the chaos? Or more accurately, can we separate meaningful signals from the noise?
Yes we can. And that’s why we asked Freeport Society friend Tom Gentile for permission to share a recent essay with you.
Tom’s a pioneer in harnessing the power of computers to spot profitable trading setups in the market. His software helps him spot hidden patterns in the market that let agile investors like you profit.
Unsurprisingly, he’s widely known as “America’s Pattern Trader.”
He’s made millions of dollars over his career as a trader and trading educator, despite coming from humble beginnings in a small steel town just outside Pittsburgh. His secret to success isn’t a secret at all. He’s driven by that red-blooded American spirit that made this country the greatest economic power ever. And he was born with an uncanny ability to spot patterns in everything around him.
Below, he shares with you his five-step plan to quickly decode the markets… a strategy that is borne out of patterns he’s uncovered in the market’s five biggest asset classes.
And on Tuesday, July 9, at 8 p.m. ET, Tom is holding a special event called The Final Phase, in which he’ll share details about a new “asset class” with its own obscure 30-day profit cycle. Played the right way, investors could walk away with up to $30,000 in about a month, if not less.
This is free to the public, but registration is required so you can join via a private, secure link that will be emailed to you. A quick click here will get you signed up.
Over to you, Tom. And thanks for letting us share.
To life, liberty, and the pursuit of wealth,
Charles Sizemore
Chief Investment Strategist, The Freeport Society
Quickly Decode the Markets With Pattern Recognition
By Tom Gentile, America’s Pattern Trader
One of the biggest challenges investors and traders face is the endless – meaningless – financial markets chatter in the media and online.
To grow your wealth efficiently and reliably, you must cut through that noise. You must focus ONLY on what matters. And this you can do by decoding the market patterns.
In my more than three decades as a trader, I’ve found you can do this by looking at just five asset classes…
- Stocks
- Bonds
- Commodities
- Currencies
- Cryptocurrencies
These five asset classes represent just about the entire global economy: The $93 trillion stock market… the $133 trillion bond market… the $131 trillion commodities market… and so on.
But recently a sixth asset class has arisen. While the five groups we know are all decodable by simply looking at one or two exchange-traded funds (ETF) for each, that sixth one is trickier. That’s why I’m hosting a live event on Tuesday, July 9 at 8 p.m. It’s called The Final Phase. It’s free to attend, but you must register to get the private access link via email.
Before I expand on the potential this sixth asset class is offering investors now, let’s cover the five old stalwarts…
Asset Class #1: Stocks
Tracker: SPDR S&P 500 ETF Trust (SPY)
As one of the most widely watched indexes, the S&P 500 tracks the performance of the 500 largest U.S. stocks. And the SPDR S&P 500 ETF Trust (SPY) tracks the performance of the index.
SPY is a great way to gauge the health of the overall stock market. And being the most liquid security in the market, it’s easy to trade.
Analyzing SPY reveals some of the market’s most powerful seasonal trends. For example…
- November to April is the “best six months” seasonal pattern (with April being the strongest month for stocks overall).
- September, meanwhile, is the weakest month.
These historical seasonal trends are important to consider against current market trends and real-time data.
I’ve had a target of 550-580 for SPY for the last several weeks now…
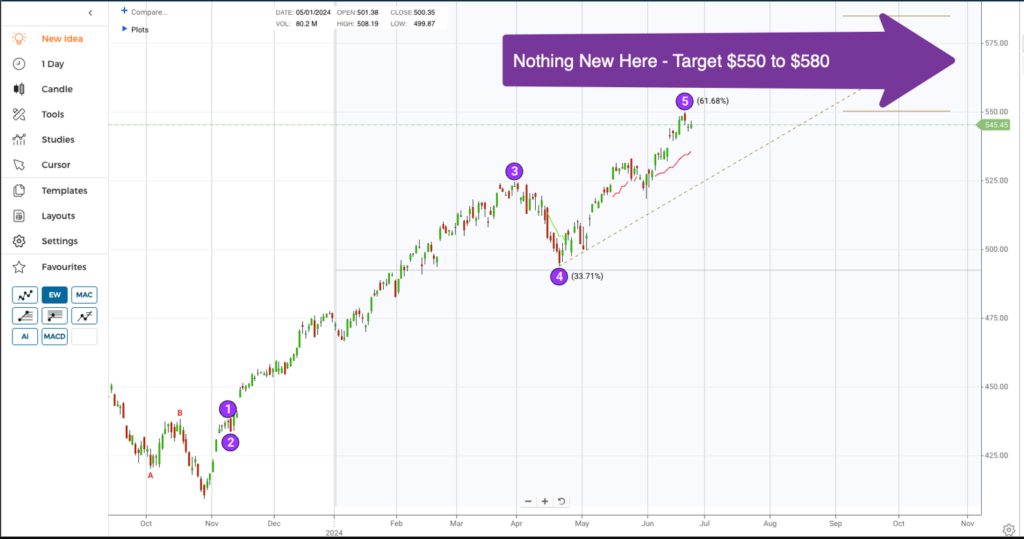
On Friday, we saw SPY touch 550 before bouncing off and heading lower, down to 546. What happens next will be critical for stocks…
Asset Class #2: Bonds
Tracker: iShares 20+ Year Treasury Bond ETF (TLT)
The iShares 20+ Year Treasury Bond ETF (TLT) tracks prices of U.S. Treasury bonds with remaining maturities greater than 20 years. This gives you an excellent snapshot of the $133 trillion bond market. And it’s a great way to gauge how investors are feeling about inflation.
Bond math means that prices go down (and yields go up) as inflation rises. So, if TLT is falling, it shows investors are worrying about inflation going up. If it’s rising, it tells you that inflation fears are waning.
Looking at a chart of TLT can also tell you a lot about what’s coming for stocks.
For instance, when TLT is trading in what I call the “Goldilocks Zone” (not too hot, not too cold), that’s bullish for stocks… because investors aren’t worried about rising inflation or dangerous deflation.
In fact, bonds have spent the last few weeks right in the sweet spot…
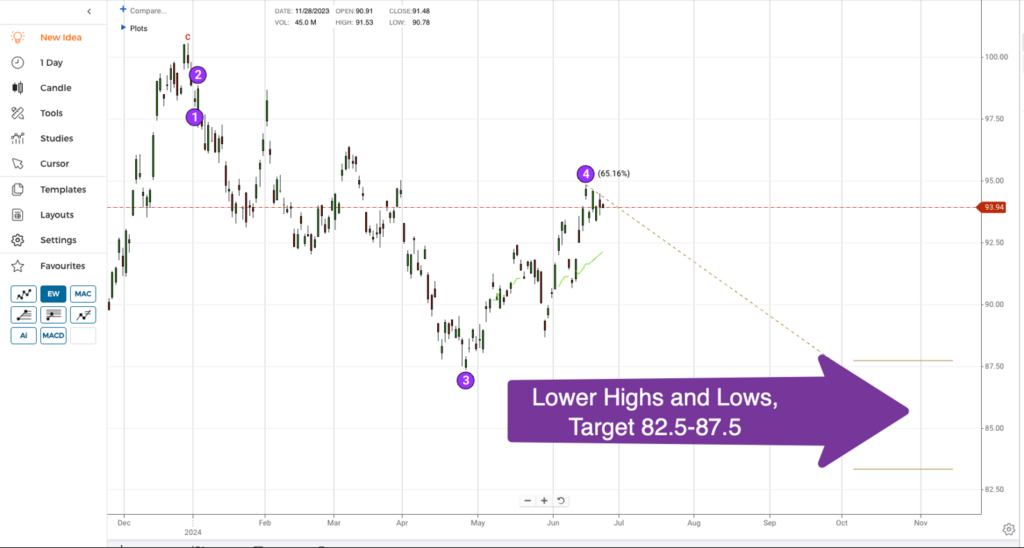
Now, however, after a series of lower highs and lower lows, I see TLT heading lower in the next few months.
Asset Class #3: Commodities
Trackers: United States Oil Fund LP (USO) and SPDR Gold Shares (GLD)
Commodities are the “stuff” that make the economy run. So their prices tend to go up when the economy is growing and demand is rising. Likewise, their prices tend to fall when the economy is shrinking and demand is falling.
You don’t need to keep an eye on the thousands of commodities that make up this $131 trillion market. Things like cocoa, cotton, and coffee don’t really matter to the overall economic picture. But oil and gold do. In fact, they’re the two commodities that drive the markets.
To get a snapshot of the oil market, I use the United States Oil Fund LP (USO). It tracks the price of U.S. crude oil – also known as West Texas Intermediate (WTI)
When USO is going up, it’s usually a sign of increased demand from a growing economy. Plummeting oil prices, on the other hand, signal the economy is in trouble.
For gold, I track SPDR Gold Shares (GLD). This ETF tracks the price of gold by storing physical gold in vaults on behalf of investors. Because investors see gold as a safe haven during market turbulence, you know that there’s trouble ahead when gold prices rise. Conversely, a falling gold price is usually a sign that folks are happy loading up on riskier assets like stocks.
Now, oil and gold both have seasonal patterns that crop up throughout the year, and we pay close attention to both.
For example, this month, gold is entering a strong seasonal bull pattern. So I’ll be paying special attention to gold – and showing you how to profit – in the coming weeks in my free daily e-letter, Patterns & Profits.
Asset Class #4: Currencies
Tracker: Invesco DB US Dollar Index Bullish Fund (UUP)
The U.S. dollar is the world’s reserve currency. Even if you live overseas, if you want to buy commodities, they’re priced in dollars. And roughly half of all international trade is done in dollars as well. That makes it the most-watched currency in the world.
A strong dollar can have a negative correlation for stocks. I could write an entire essay on the subject, but long story short, a strengthening U.S. dollar is often associated with higher interest rates, as investors flock to the relatively safer and higher-yielding U.S. assets.
Higher interest rates can increase borrowing costs for companies, reducing their ability to invest in growth and expansion.
A strong dollar also makes U.S. goods more expensive for overseas buyers.
And multinational companies that earn a significant proportion of their revenues overseas see the value of those foreign currency earnings drop in U.S. dollar terms.
So, I like to keep an eye on the Invesco DB US Dollar Index Bullish Fund (UUP) for signs of a strengthening or weakening dollar to help inform my trading.
For example, if we’re in the middle of a seasonal bear pattern and the dollar is getting stronger, that’s additional confirmation that a bearish trade is the way to go.
If I’m already bullish on U.S. stocks, and I see weakness in the dollar, it may be time to place more bullish trades.
Right now, the dollar is getting stronger…
In fact, UUP has risen nearly to $30 – a level it hasn’t seen since the pandemic…
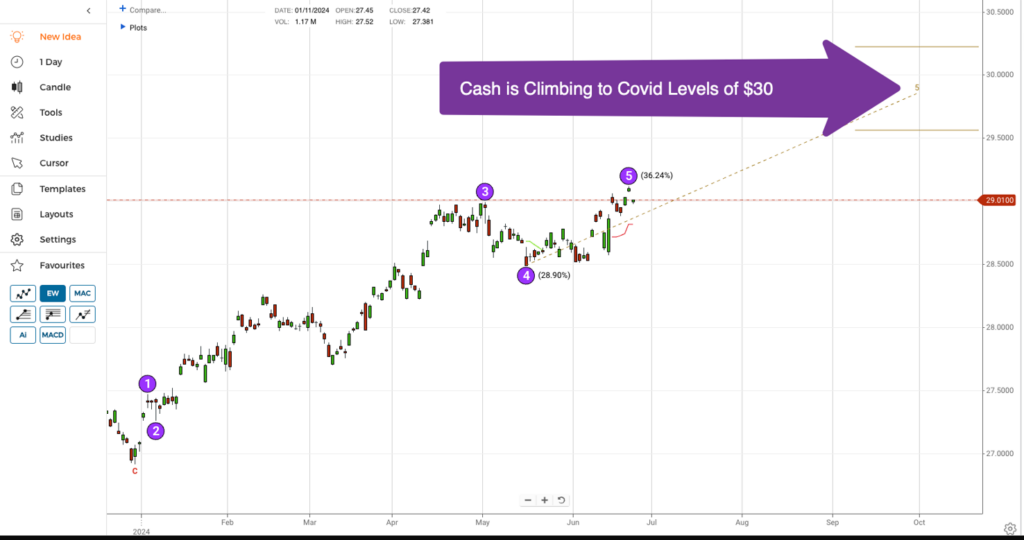
The strength of the dollar could weigh on stocks in the near term. I’m keeping an eye on it.
Asset Class #5: Cryptocurrencies
Trackers: Bitcoin (BTC-USD) and Ethereum (ETH-USD)
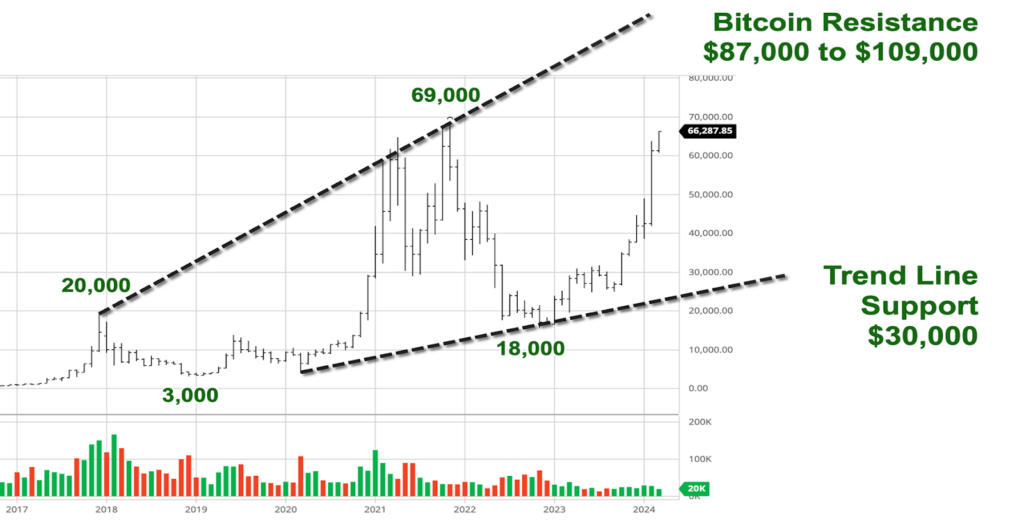
Bitcoin (BTC-USD) is the world’s first and largest cryptocurrency. It makes up 54% of the $2.5 trillion crypto market. That makes it the No. 1 indicator of the health of the crypto market.
When Bitcoin is going up, bullish sentiment takes hold and spreads to thousands of smaller coins. When it’s going sideways, the entire crypto market tends to follow suit. When it crashes, we can get a severe “Crypto Winter” bear market.
So, if you want to successfully trade the crypto market, you’ve got to pay attention to Bitcoin. If Bitcoin is rallying, investors are in “risk on” mode. That’s good news for more speculative stocks, too.
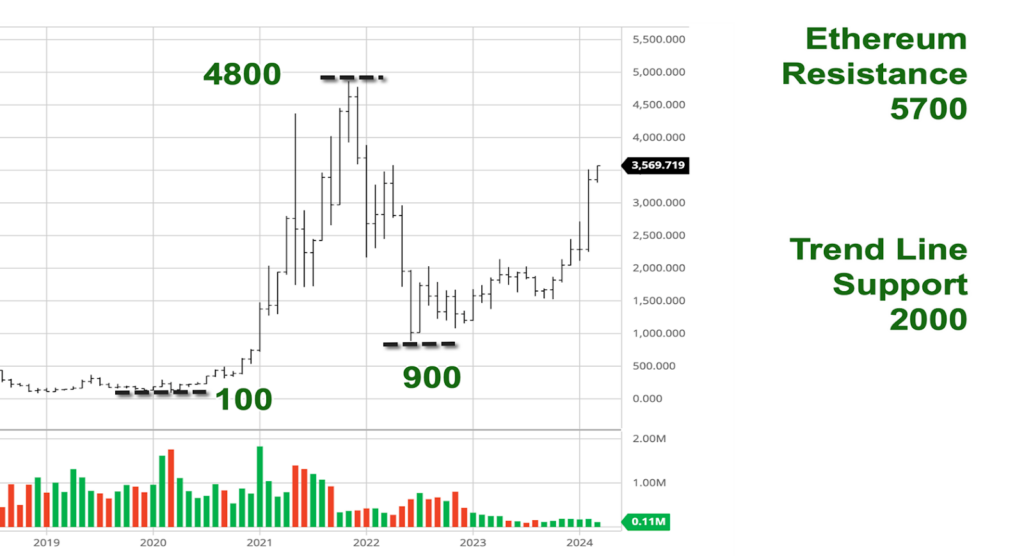
I also look at the world’s second most valuable crypto, Ethereum (ETH-USD).
Like every other asset class I track, crypto is subject to seasonal patterns and cycles. Money flows first into Bitcoin… then into Ethereum… then into smaller, more speculative “altcoins” (coins other than Bitcoin and Ethereum).
So, when Ethereum is outperforming Bitcoin, I pay attention. It tells me the altcoin market is about to take off. This helps me uncover outsized gains in the altcoin market – the kind you can trade for 1,000%+ gains in a short time.
And despite recent pullbacks in both Bitcoin and Ethereum, my projections for both remain extremely bullish…
At Patterns & Profits, I update my readers on these five asset classes every Monday afternoon in my Five Points of the Market video. In just 10 minutes every week, I’ll show you the key levels I’m watching for each one… how I think they’ll perform through the week… and what it all means for your bottom line. To join me and get free daily insights at Patterns & Profits, click here.
Beyond that, join me on Tuesday, July 9 at 8 p.m. ET for my live discussion – The Final Phase – of the new sixth asset class that has formed in the last year. It has an obscure 30-day profit cycle that investors can take advantage of. If you know what to do… and when to do it… you could have the chance to make up to $30,000 in about 30 days… and then repeat that indefinitely.
This is a free event, but you must register to receive the private access link to attend. You can do that here.
Good trading,
Tom Gentile
America’s Pattern Trader