Chief Investment Strategist, The Freeport Society
Charles’ Note: Well, that didn’t last long. I warned yesterday that the trade war wasn’t over. And no sooner had I hit the send key on yesterday’s Navigator, the U.S. Court of Appeals reinstated the tariffs pending a longer review in June.
The tariff mess will get sorted out when it gets sorted out. The market seems to be mostly immune to tariff headlines at this point.
But there’s a much bigger issue looming… and it’s not one that a court can simply kick down the road.
The bond market is stirring. The bond vigilantes have awakened from their long slumber and are not at all pleased with what they see coming out of Washington.
I’ve been warning since the launch of the Freeport Society that the dollar was at risk. Investors are starting to question Uncle Sam’s creditworthiness… and demanding higher interest rates as compensation.
What does that mean for our investments?
To answer that, I asked my friend Jeff Clark to weigh in. Jeff is a 40 year market veteran. He is also one of the best volatility traders I know and volatility is the name of the game in this Age of Chaos.
Jeff has delivered more than 1,000 winning trade recommendations to date, navigating 11 presidential transitions and all the chaos in between.
Today, he shares with you what he’s seeing in the bond markets. Best be sitting down for this one.
I’ll be having a longer interview with Jeff next week, so be sure to watch your inbox for that.
Over to you, Jeff!
The Most Dangerous Chart in the Market Right Now
By Jeff Clark, Editor, Market Minute
This is the most dangerous chart in the financial markets…
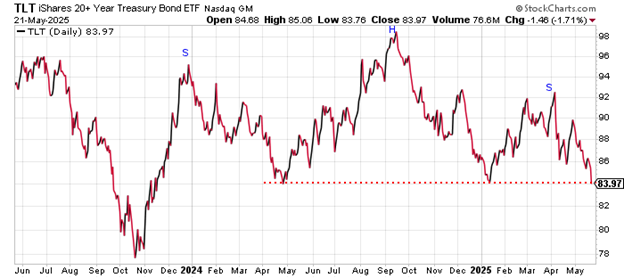
It shows the iShares 20+ Year Treasury Bond Fund (TLT). That’s an exchange-traded fund that tracks the action in long-term Treasury Bonds.
And, it’s breaking down.
Why is that dangerous?
Because, as bond prices fall, longer-term interest rates rise.
Rising rates are bad news for stock prices.
Understand, the Federal Reserve Board sets the target for short-term Federal Funds interest rates. That’s the rate over which stock market investors have been obsessing. That’s the rate most folks expect the Fed will cut two or three times this year.
Bond investors determine what happens with longer-term interest rates.
Based on the look of the above chart, TLT is set to fall. That means longer-term rates are set to rise.
TLT peaked in September near $99 per share. It then declined all the way to $84 in January, where it found support and bounced.
That bounce ran out of steam last month.
TLT has been falling for six straight weeks.
Now it looks like TLT is set to lose the support of the $84 level. If that happens, we could see a quick drop to the October 2023 low near $78.
That would put long-term interest rates near 5.6%, or even a bit higher. We haven’t seen long term rates that high in 20 years.
And, it’s happening at a time when the U.S. Treasury has to refinance trillions of dollars in maturing debt… and when the government is trying to pass a budget that will add trillions more to the deficit.
Stock market investors have ignored this situation, so far. TLT is down 8% over the past six weeks. Yet, the S&P 500 is sharply higher.
Somebody is lying.
Stocks and Treasury bonds typically move in the same direction. So, this sort of divergence is notable.
One of these assets is due for an epic reversal.
Either Treasury bonds need to rally to catch up with the action in stocks, or stocks are going to be pulled down to match the action in bonds.
The widely accepted opinion on Wall Street is that bond investors are smarter than stock investors.
We’ll soon find out if that’s true.
Best regards and good trading,

Jeff Clark
Editor, Market Minute