Senior Analyst, Freeport Strategic Opportunities
Being a contrarian isn’t easy.
It’s lonely.
It’s uncomfortable.
It’s necessary.
Because it can pay off in a big way.
This is especially true with tariffs and their potential inflationary effect today.
Trump’s trade war has dominated the headlines ever since he held Liberation Day.
He’s wielded tariffs like a sledge hammer, slamming a 145% general tariff on China. Then exempting things like auto parts. And that’s not even scratching the surface.
It’s a constantly moving target that’s creating extreme volatility in the markets and creating uncertainty in the economy. And it’s brought the threat of inflation back to the top of the worry wall. At least according to the consensus view.
But what if everyone is wrong?
What if tariffs aren’t inflationary after all?
What if they’re actually deflationary, where prices fall? Or disinflationary, where they rise at a much slower rate?
If that’s the case, which I believe it is, then if you’re preparing for inflation and you get disinflation, it’s probably not going to help your portfolio.
So today, I’ll explain why you should be focusing on lower prices ahead… and how you can prepare your portfolio for it. Even better, I’ll share a way to profit from it.
Look at the Clues
This week the Fed kept interest rates steady at 4.25% to 4.5%. Fed Chair Jerome Powell’s reasoning is that while the economy is on solid footing, hot inflation is a worry.
That’s led to much of the mainstream media and many analysts throwing around the term stagflation.
Stagflation is when we have double-digit inflation, negative growth, and skyrocketing unemployment.
It’s what made the 1970s so difficult.
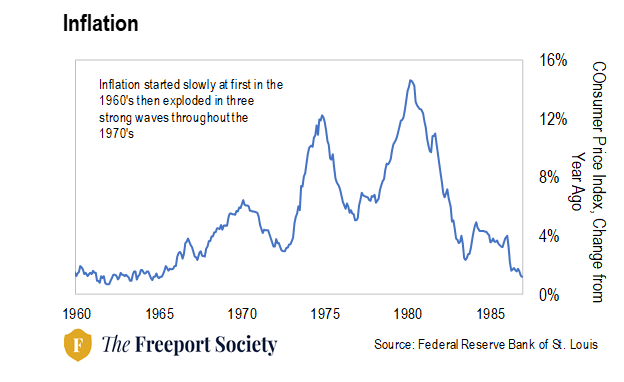
At the start of the decade, inflation was heading higher, albeit slowly at first. We can see this in the chart below.
Then the oil price shock hit following the 1973 oil embargo, when OPEC cut off oil exports to the U.S. and other Western countries in retaliation for their support of Israel…
That led to scenes like this one…
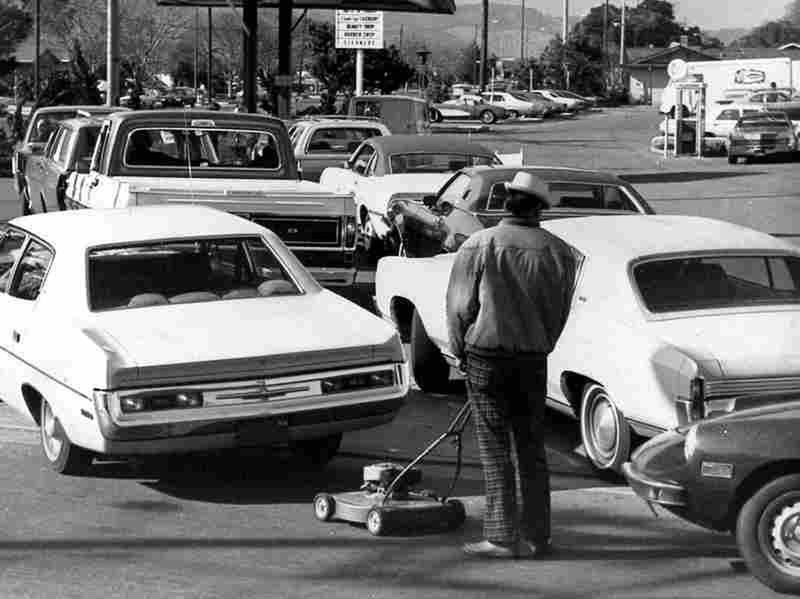
Source: groovyhistory.com
It became a self-fulfilling feedback loop. Inflation ran out of control in three strong waves. Rising unemployment didn’t help with the unemployment rate hitting a peak of 8.2% in 1975.
It ignited stagflation, which choked the economy and consumers.
That’s not what we’re seeing today.
Publicly “defying” Trump by keeping rates steady… or screaming that we’re heading for 1970’s style stagflation both make for great headlines… at least in some circles.
But it’s just smoke and mirrors.
And when you filter through the noise, you’ll find something different is happening.
What’s really in motion is a much slower rate of inflation than most people believe.
This next chart shows our current measure of the Consumer Price Index (CPI).
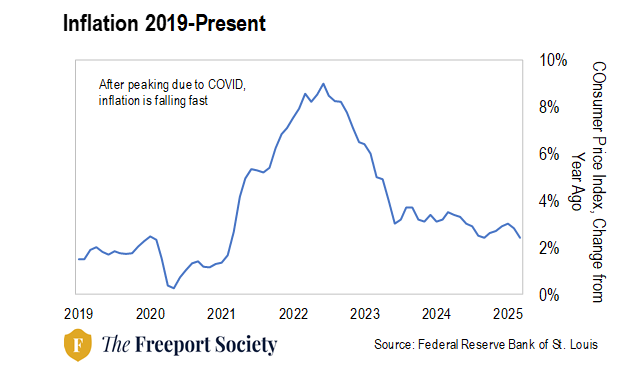
As you can see, after a peak of 9.1% annual inflation, the official rate of inflation continues to decline. Today it stands at 2.4%, not far from the 2% target set by the Federal Reserve.
But, there’s a little-known, more accurate measure of inflation…
Real Life Inflation Vs. Government Data
Truflation is a private company that publishes its Truflation index. It uses real-time data from more than 15 million goods and services tracked on a daily basis. It takes into account things like food, housing, transportation, utilities, and a whole host of other things consumers spend on.
And it has a 99% accuracy rate in predicting inflation.
Today, the Truflation number stands at 1.46%. That’s down from 3% at the beginning of the year.
That’s hardly the go-go inflation days of the 1970s.
And just as with CPI, the number continues to fall.
Now, it may not seem like prices are falling or rising at a much slower rate. That’s in part because after the recent bout of inflation a few years ago, they hit a new baseline. So it may feel like things are getting more expensive rather than the opposite.
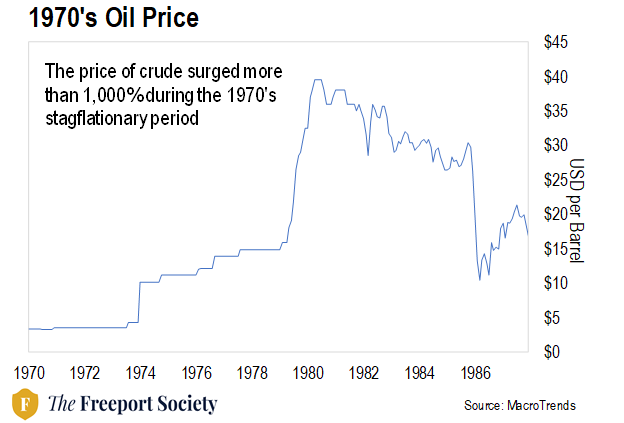
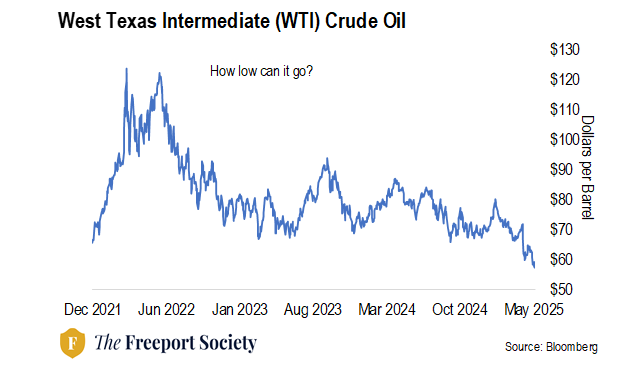
However, that may change sooner than later. That’s because another compelling piece of evidence that inflation is dead in the water is the price of crude oil.
People often forget that oil makes the world go round.
You need it to make just about everything we consume, from our moisture-wicking gym shirt to the laundry detergent we wash it with. Or build the things that we need, from the cars we drive (which run on gas but also contain parts made from crude oil) to the paint we cover our walls with.
Without it, the world would literally screech to a halt.
Yet what’s happening in oil today is nothing short of a complete freefall.
And with the U.S. as the largest single producer of oil today by far, I doubt we’ll see anything like the gas lines experienced in the 70s.
Add in the fact that the unemployment rate is 4.2% and it’s clear as the nose on my face that we’re far from a stagflationary environment..
The reality is, tariffs are proving to be deflationary. Here’s an example…
What Gold and Air Travel Shows Us
Take the mining industry as a case in point.
About 25% of the costs of a gold mining operation depends on energy derived from mainly diesel fuel. So when oil prices collapse and fuel prices fall along with it, the miners’ profit margins increase.
And with gold up near its all-time highs, I expect profits for gold miners to rip higher in the coming quarters.
Another industry where this is playing out is air travel.
Fuel accounts for about 30% of the operating costs for airlines. Typically, when fuel prices rise, airlines quickly pass off that cost to consumers by raising ticket prices. But when fuel costs fall, they’re much slower to lower airfares. Instead, they soak in higher profit margins.
These are just two examples of many – with countless more popping up every day.
They are also the best place to start when it comes to preparing your investments for a very different environment to the one everyone’s worried about.
Look to industries that benefit from things like lower oil prices. Start adding exposure to them in your portfolio.
In particular, look to the airlines. They haven’t had the best year to date. They’re virtually down across the board. American Airlines (AAL) is down about 40% year to date. Delta Airlines is down about 24%. United Airlines is lower by about 23%.
But that may change in the coming quarters thanks to the deflationary pressures everyone’s ignoring. An easy way to play this is through the U.S. Global Jets ETF (JETS).
Regards,
John Pangere
Editor, Freeport Strategic Opportunities
P.S. Are you seeing deflation in any other businesses as a result of declining oil prices? We’d love to hear your stories. Write to us at [email protected]. And feel free to ask any questions you may have about deflation, inflation, stagflation, gold, oil… or anything else.