
CEO, Tradesmith
Editor’s Note: Keith Kaplan’s TradeSmith Seasonality Tool has been lighting up like a Christmas tree these past few days.
If you’re not already familiar with TradeSmith, it’s a leading fintech platform that helps people in 86 countries track $30 billion in assets.
Its mission is to get world-class analytics in the hands of as many investors as possible to help level the playing field with Wall Street elites.
One of its most powerful – and popular – tools spots seasonal windows when stocks are most likely to go up.
It runs a staggering 50,000 tests a day to analyze every stock in the major indexes and zero in on the ones with the strongest seasonality trends.
It’s hard to believe if you haven’t seen the tool in action. But some stocks trade so consistently – rising or falling during specific windows, year after year – that you can map out a year’s worth of great trades.
This is true for the indexes and markets in general as well. They too follow predictable seasonal patterns.
Now, today, July 30, marks a major seasonal turning point, based on more than three decades of market data.
Keith’s system is designed to identify these inflection points before they happen and pinpoint the exact stocks most likely to move.
But here’s the thing…
This signal may be even more important, especially for investors who want to sidestep the volatility that tends to blindside buy-and-hold portfolios at this time of year.
Keith walked through the data – and revealed his full calendar of “green zone” trades – in a powerful event last week. If you missed it, you can catch a replay here.
Watch it now because it goes offline tonight at midnight.
Today, Keith shares more details about the looming market shift. Keep reading for his latest insights into what this could mean for your portfolio.
Most Aren’t Ready for the Looming Market Shift
By Keith Kaplan, CEO, TradeSmith
It was the first Big Short.
In the summer of 1929, Jesse Livermore – the most famous trader of his day – quietly reversed course.
After riding the roaring bull market for the previous year, he sensed the turn.
The headlines were still euphoric.
Stocks were shattering records and pulling people from all walks of life into the stock market.
But experience had taught Jesse that it’s better to sell early into strength than get caught in the downdraft.
So, as the crowd piled in, he sold all his stocks – and began preparing to short the market (bet on stocks falling).
From his private “war room” in the Heckscher Building on Fifth Avenue, he began building bearish positions in overextended stocks.
To keep things quiet, he changed brokers constantly, used more than 100 accounts, and even tracked his trades with secret chalkboard symbols no one else could decipher.
His preparations paid off… spectacularly.
By the time Black Tuesday hit, on October 29, he’d made $100 million – $1.7 billion in today’s money. This made him one of the richest men in the world.
And it all came down to one simple truth: Markets move in cycles. Not just boom and bust cycles, but also seasonal cycles that repeat year after year.
Some seasons reward risk. Others punish it. The key isn’t constant action – it’s knowing when to act.
“There’s a time to go long. A time to go short. And a time to go fishing,” Jesse said.
And he meant it.
During slow stretches – especially in summer – Livermore would disappear to his yacht off Montauk and fish for swordfish.

The hard part, of course, is timing these seasons.
Livermore used his instinct and his experience as one of the world’s greatest traders.
My team of top data scientists and computer programmers set out to solve the same problem by running 50,000 tests a day across 33 years of stock market history.
Our Seasonality Tool analyzes all that data to pinpoint the calendar dates when stocks – even entire indexes – tend to turn.
We’ve found stocks that hit their seasonal inflection points with 83% back tested accuracy.
And right now, the data is pointing to something big.
Our system is predicting a major shift in the stock market, today.
Not a crash, like in 1929.
But it’s the kind of bearish seasonal pattern Jesse would have watched closely – even if from the deck of his boat.
Last week, I hosted a special online event to walk you through what’s coming. I also showed you how to profit by embracing a “rapid-fire” new type of investing. You still have time to watch the replay here.
For today, let’s go through the latest seasonality chart for the S&P 500. Pay close attention to the shift coming up.
Are You Ready for the Coming Market Shift?
Take a look at the chart below…
Green shaded areas represent times when the index tends to go up.
The white areas are times when the index tends to fall.
As you can see, it’s been prime time for the S&P 500 since the end of June.
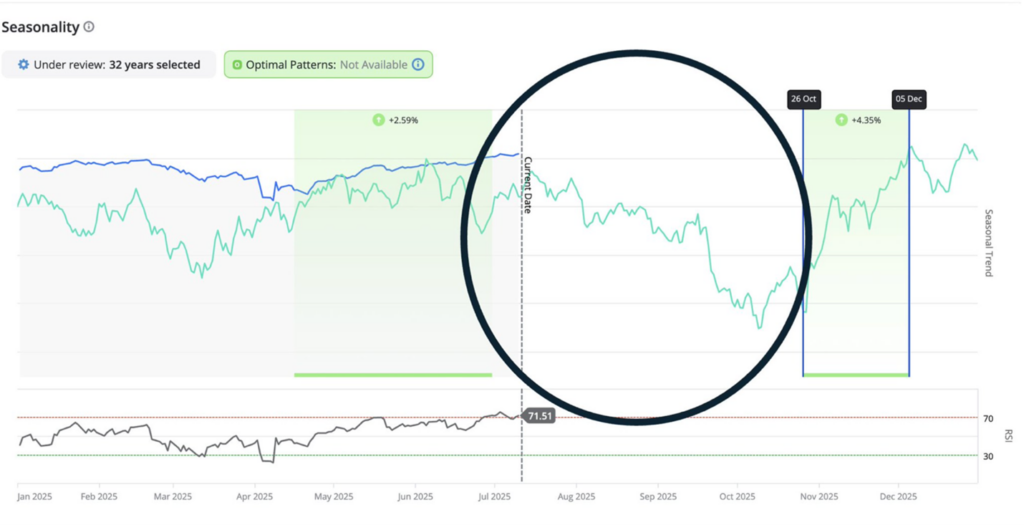
The June 28 to July 28 window has produced gains 15 years in a row.
But following this bullish window, we get a major regime change (circled area on the chart).
Historically the S&P 500 has fallen more than half the time over the next three months, with an average return of MINUS 1.8%.
But this coming market shift isn’t a reason to panic. I’m NOT recommending you step away from the market entirely. Just be prepared to take profits quickly during the regime change that’s coming.
That’s exactly what I got into during my seasonality event last week.
Look at the gains our current seasonality subscribers have been able to rack up on individual stocks by combining our system’s signals with the power of options trading.
- 112% on Hasbro (HAS) calls in 10 days
- 107% on Aon (AON) calls in 23 days
- 124% on Booking Holdings (BKNG) calls in 15 days
- 180% on Analog Devices (ADI) calls in 14 days
- 248% on Intuit (INTU) calls in 15 days
No wonder it’s been such a huge hit with the first group of traders who had the courage to try our seasonality tool when we unveiled it in January.
Now that you know of the new seasonal pattern about to unfold, you can grow and protect your portfolio as well.
P.S. In the replay of my seasonality event, you’ll see me demonstrate on camera how you can use TradeSmith Seasonality Tool to boost and protect your wealth. I cover…
- The exact days to buy and sell a stock based on that its unique, historical “seasonal” patterns without the guesswork
- How it works on stocks, stock market indexes like the S&P 500 and the Nasdaq, even currencies and commodities
- How you can use it to compliment my fundamentals-based quant approach to select only the strongest trades/positions—even in volatile markets.
Check out the free replay right here.
Just remember, this goes offline tonight at midnight.